Gas Purging of Modules — Key Considerations, Purge Time Estimation and Eliminating Stagnation Areas (2)
Part 2
PURGING
2/6/20264 min read
Lets get started!
In the previous article the theoretical foundations of gas purging were explored, including the mathematical models for concentration decay and strategies for avoiding stagnation zones.
Theory provides a vital starting point, but how does it hold up when applied to a complex, real-world module? In this article, we put our formulas to the test using the Module —a representative machine housing—and compare analytical predictions against transient CFD (Computational Fluid Dynamics) simulations. We will also demonstrate how small design iterations can drastically improve purging efficiency. First thing is first:
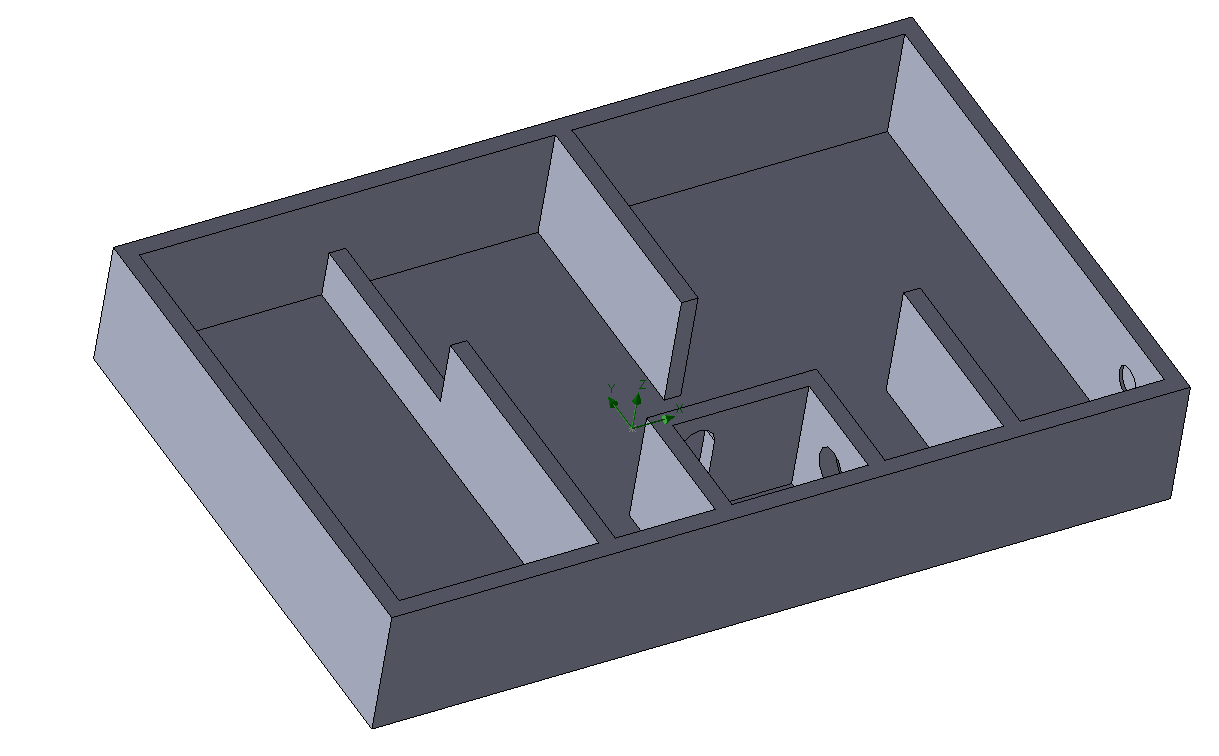
1.Introducing the Module:
To illustrate these principles, let's define our subject, the Module:
Internal Volume ($V$): $0,133625m^3=133,625l$
Internal Geometry: Complex walls, representing different chambers
Contaminant: Ambient Air (inital $O_2$ concentration $C_0=21\%$ or 210 000 ppm)
Purge Gas: Dry Nitrogen ($N_2$)
Target State: $C_{\text target}<1\%$
Flow Rate ($Q$): 50l/min = 46,66nl/min
Conditions: Isothermal (no heat transfer between module and gas)
2.Analytical Estimates:
First we'll take a look at the results from the analytical formulas from the previous article and we'll solve for the time:
Exponential decay of perfectly mixed module:
$t=\frac{V}{Q}\times ln(\frac {C_0}{C_{\text target}}) = 524s$Turnover (displacement) heuristic, asuming 5 Turnovers:
$t=\frac {V}{Q} \times N_{\text turnovers}=860s$
We see that in order to achieve 100 ppm concentration of $O_2$ acording to the analitical methods 8-15min are needed. What about he simulated result?
3.Simulated Results:
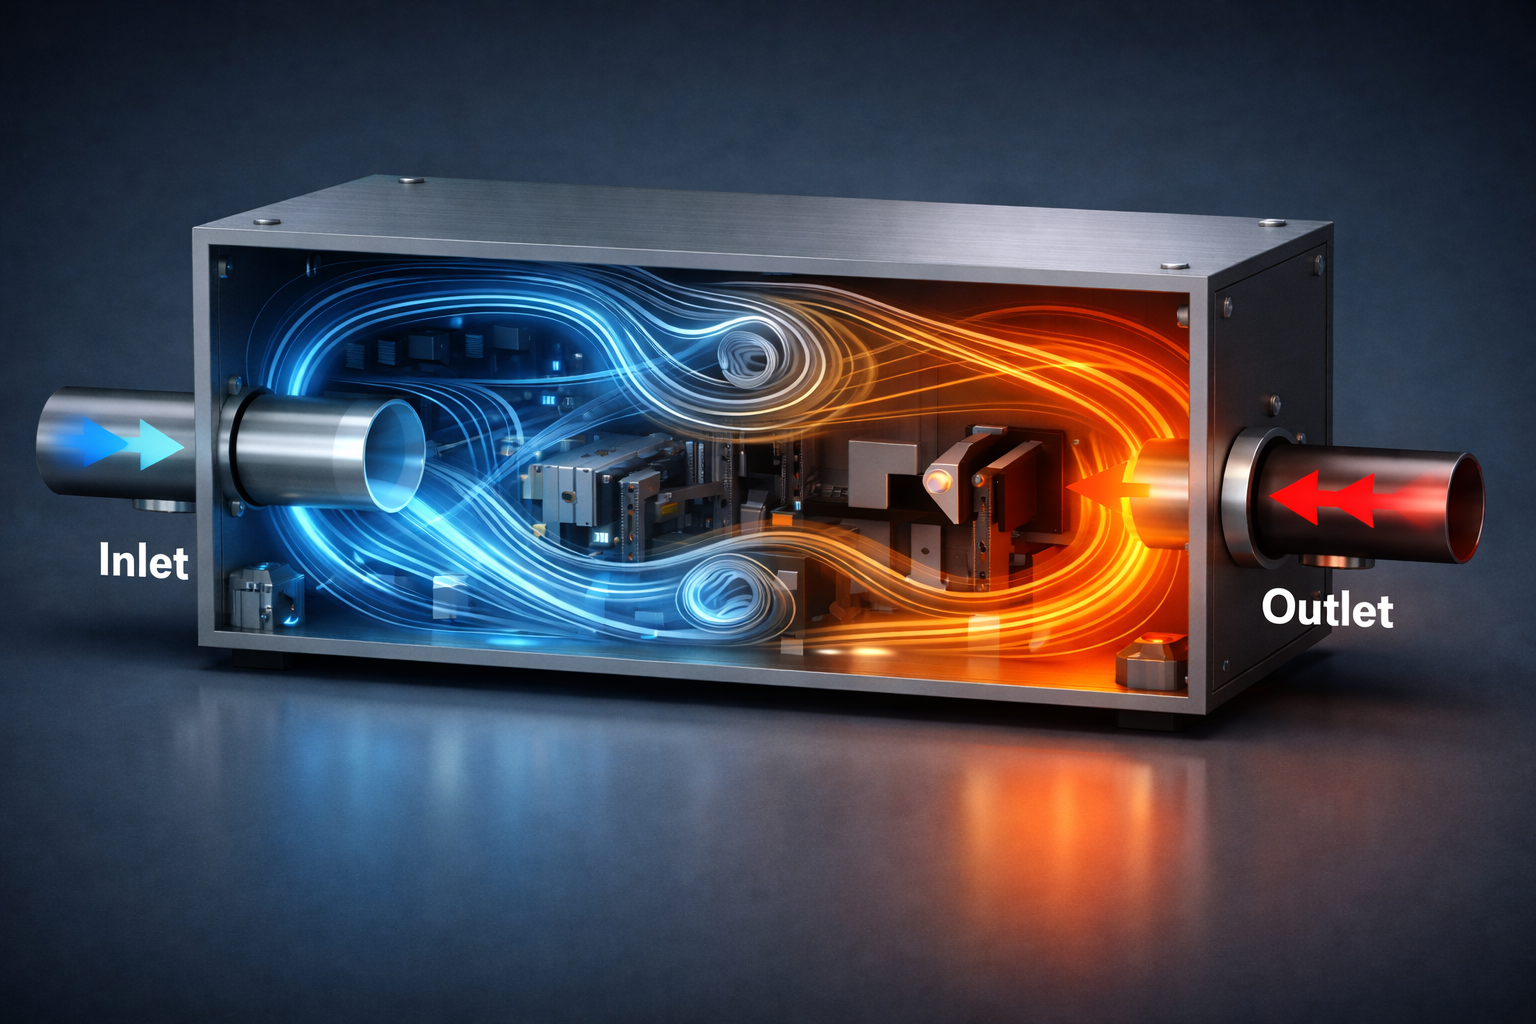
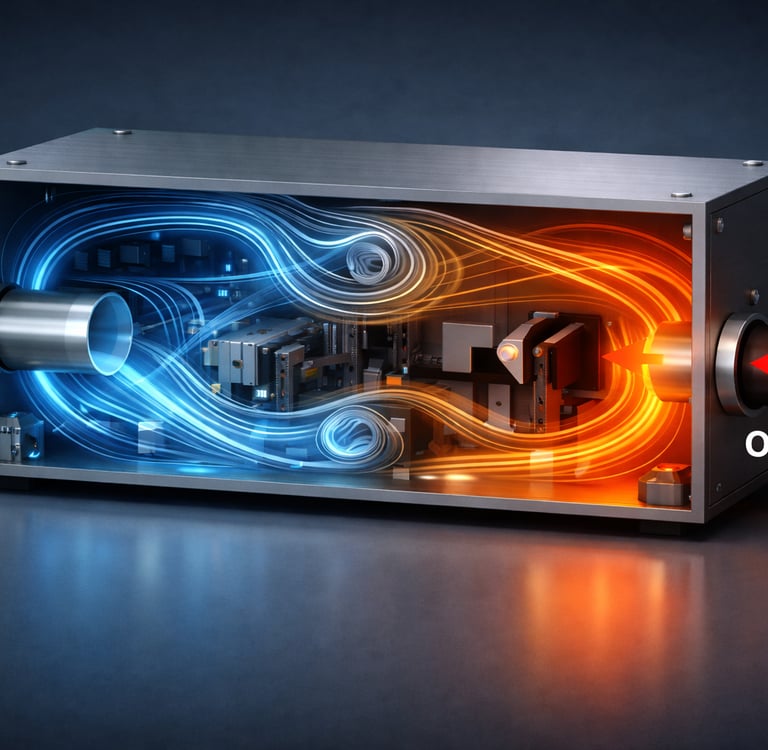
All of the simulations and analytical calculations were carried out on the module above. In order to emphasize on the importance of wise positioning of inlets and outlets, few different inlet configurations were choosen. Furthermore in the one variant the integrity of the one wall was compromised and a lotted hole was introduced.(See Image 2) Some of the important boundary conditions for the transient CFD simulations were:
Inlet: $V=50l/min$, 100% $N_2$
Outlet: ambient pressure $101325Pa$
100µm Surface roughness
Adiabatic walls/isothermal/
Global mesh: 6
0,5s time steps, saving results each 5s
Image 1: the Module
By observing the results in the table above we see the dependancy between inlet position and time to achieve 99% $N_2$ concentration. With Config 1 there is a short-circuit between the inlet and the outlet so that left cammer of the module is not flooded properly which in terms results to very high purging time (Image 4). Contrary to that in Config 2 the inlet jet hits the opposite wall and the half of the jet is guided to the left cammer. That leads to the faster purging times. Config 3 sweeps through and clears the volume being slightly slower than the analytical solution (Image 5). Now if the times to purge are still too high, on back of my head I can think of two quick fixes, than can reduce the purging time - Config 3.1 and Config 3.2.
Config 3.1 - slotted hole in the module wall, so that the flow is divided into two streams and uniform gas mixing is achieved.
Pros:
No additional Infrastructure
No flow balancing needed
Cons:
Difficult manifacturability, feedback with supplier needs to be held
Iterations to identify best design
Config 3.2 - Add one more inlet next to the recirculation area and have some purging directly into the stagnating area.
Pros:
Structural integrity of the module intact
Inlet can be placed at certain angle to capitalise from gas's momentum
Cons:
Additional Infra
Additional Risk of leakages
Flow Balancing needed
Image 3: Table with configurations and results
4. Summary:
Purging is a balance between physics and geometry. While simple formulas provide a "ballpark" figure for time to purge and, they cannot account for the flow obstacles within your module.
By identifying stagnation areas through simulation or testing—and addressing them with strategic inlet/ outlet placement and flow guides—engineers can significantly reduce cycle times, save on expensive high-purity gases, and ensure that sensitive components are protected from contaminants. After all flow will always take the path with least resistance!

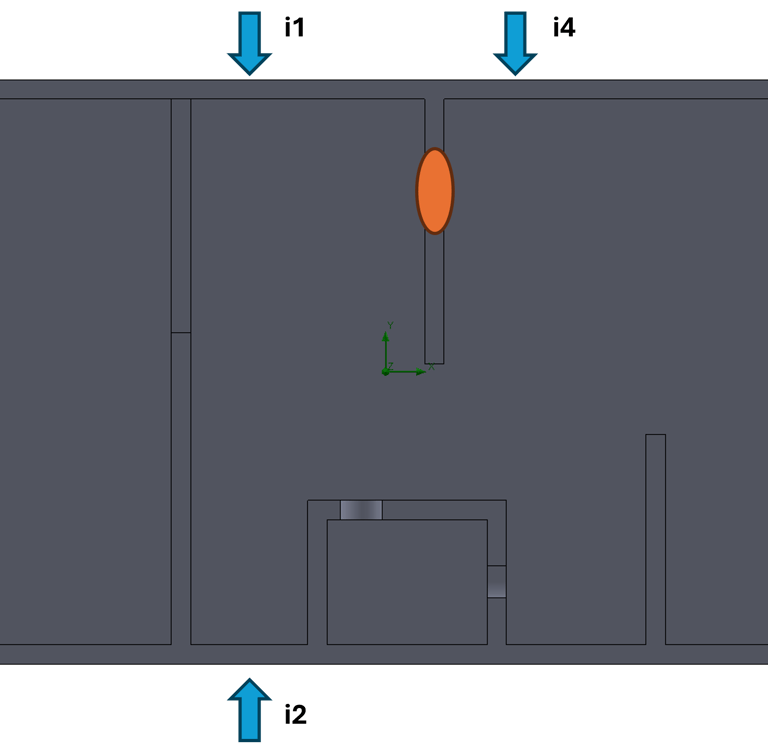
Image 2: Module with inlets/outlets
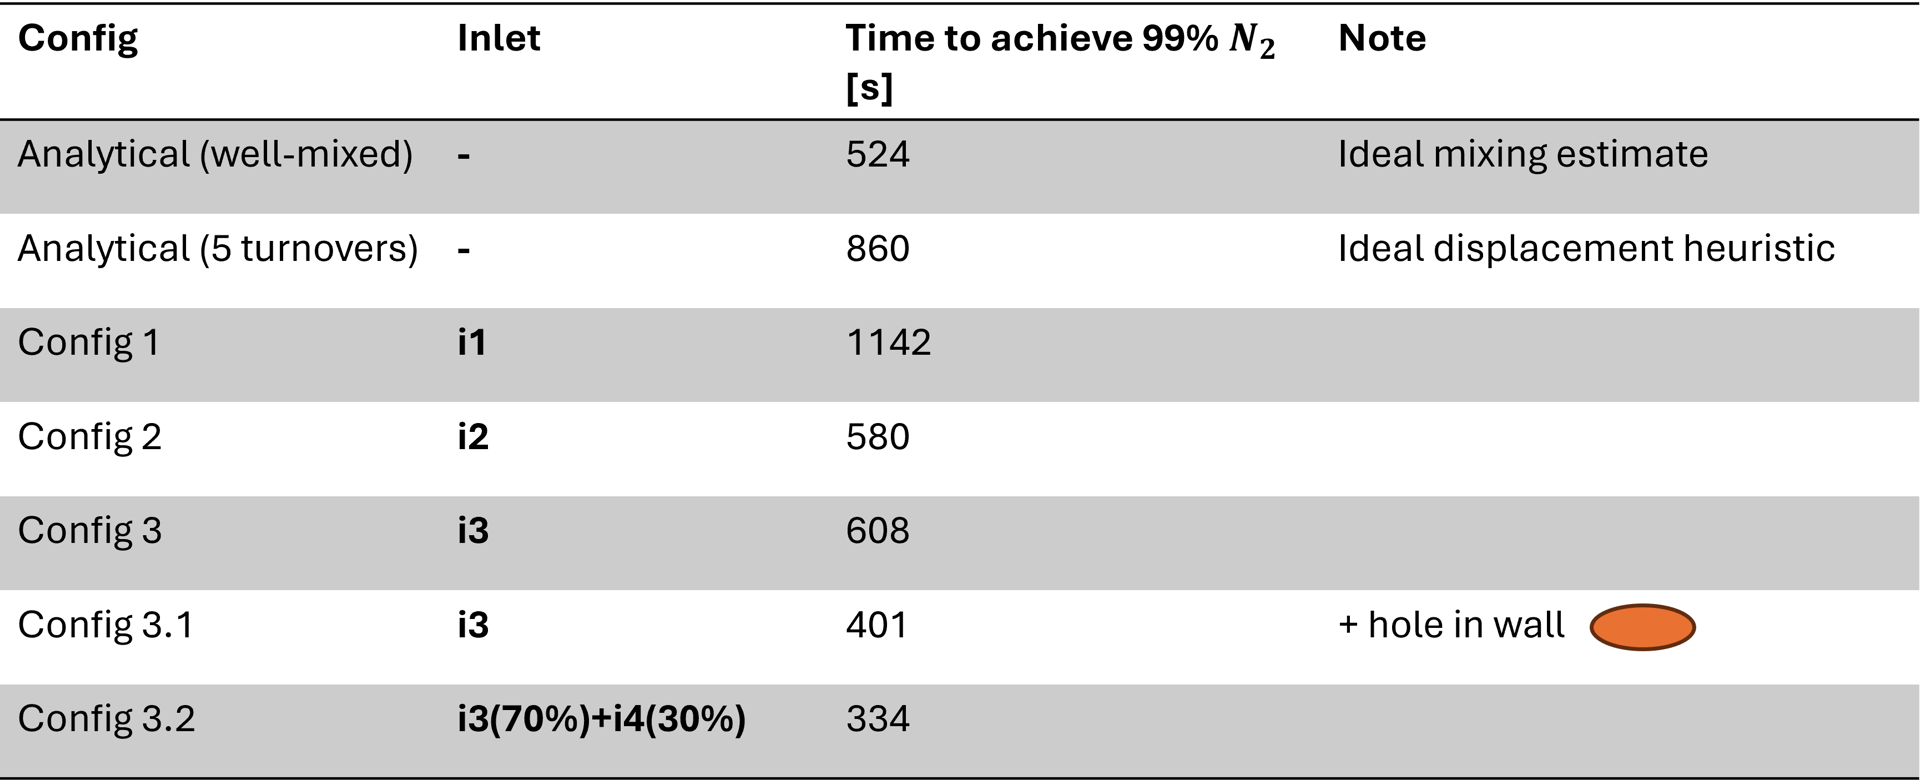
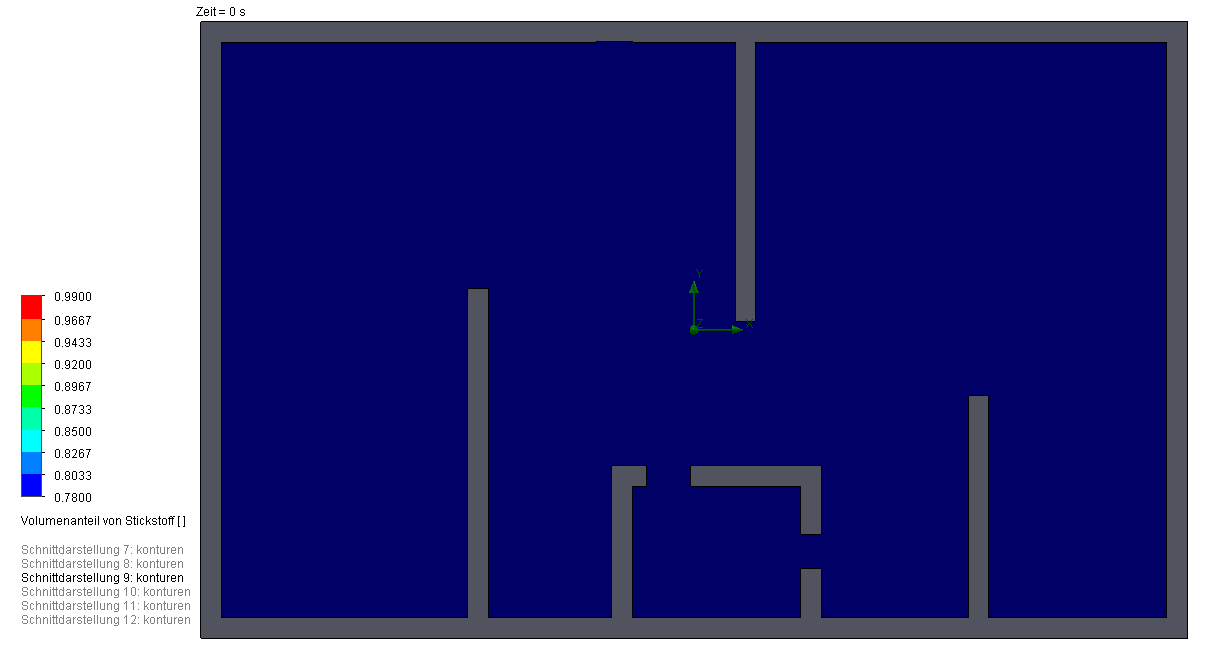
Image 4: Config 1
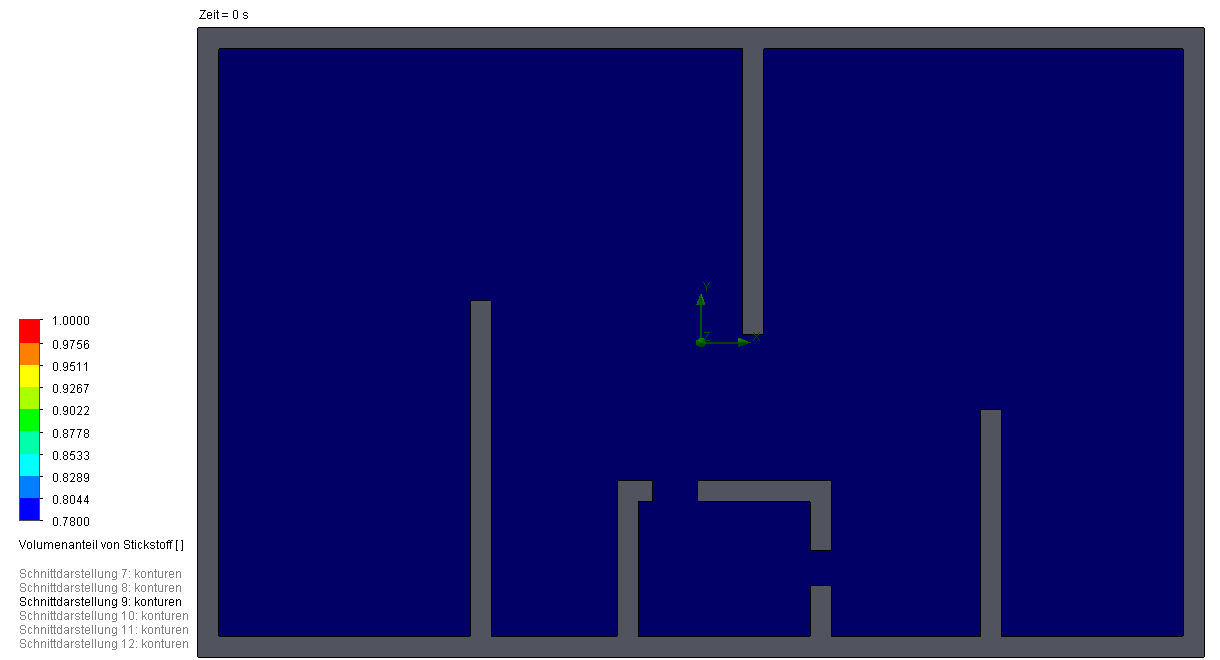
Image 5: Config 3
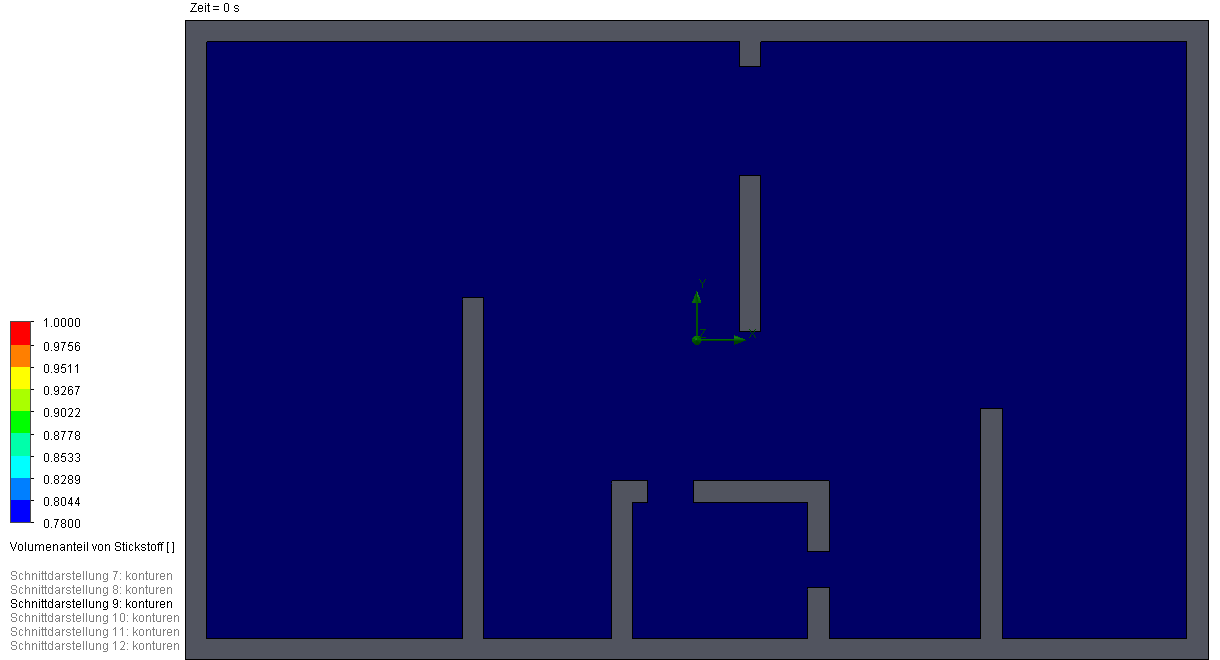
Image 6: Config 3.1
Consulting / Simulation / Analysis
Expertise in thermal management and optimization solutions.
chillwave@analytics.com
+4917657864718
© 2025. All rights reserved.